PRACTICE SERIES 1 · TEST 7
IELTS Academic Writing Practice Test 7
Visits to four types of tourist attraction · The rising cost of housing
Before you begin
Complete both tasks. Allow about 20 minutes for Task 1 and 40 minutes for Task 2. Write at least 150 and 250 words respectively. The timer is shared across both tasks.
Original IELTS-style practice material. Not produced or endorsed by IELTS, the British Council, IDP or Cambridge University Press & Assessment. Drafts save in this browser. Use Submit writing below to save your responses for review; no automatic band score is awarded.
WRITING TASK 1
You should spend about 20 minutes on this task.
The graph below shows the number of visits made to four types of tourist attraction in one country between 1990 and 2015.
Summarise the information by selecting and reporting the main features, and make comparisons where relevant.
Write at least 150 words.
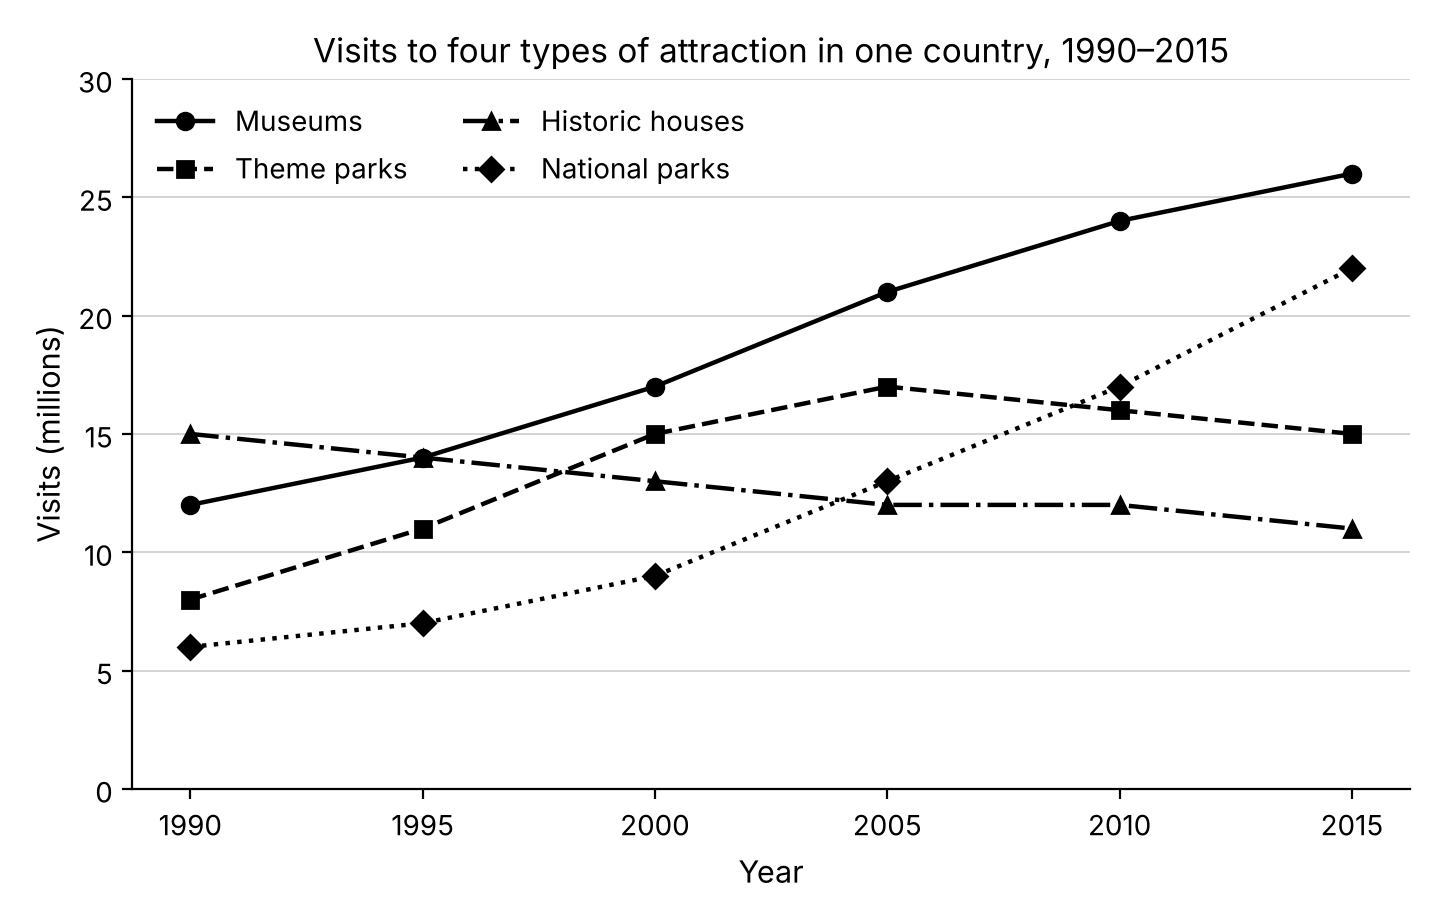
If the graph does not display, use this table. It contains the same information.
| Visits (millions) | 1990 | 1995 | 2000 | 2005 | 2010 | 2015 |
|---|---|---|---|---|---|---|
| Museums | 12 | 14 | 17 | 21 | 24 | 26 |
| Theme parks | 8 | 11 | 15 | 17 | 16 | 15 |
| Historic houses | 15 | 14 | 13 | 12 | 12 | 11 |
| National parks | 6 | 7 | 9 | 13 | 17 | 22 |
Write at least 150 words. Suggested time: 20 minutes.
Drafts are saved in this browser. Use Download my writing to keep a separate copy.
View Task 1 sample response and commentary
Write your own response before opening this example. This is a sample from the book, not a score or assessment of your writing.
The line graph compares the number of visits made to museums, theme parks, historic houses and national parks in one country between 1990 and 2015.
Overall, three of the four types of attraction were visited more often in 2015 than in 1990, with museums becoming the most popular attraction from the late 1990s onwards. National parks showed the most dramatic growth, while historic houses were the only attraction to see a fall in visits.
In 1990, historic houses were the most visited attraction, with 15 million visits, followed by museums with 12 million. However, visits to historic houses fell gradually throughout the period, apart from a brief levelling off between 2005 and 2010, reaching 11 million in 2015, the lowest figure of the four. Museums, by contrast, grew steadily, overtaking historic houses in the late 1990s and more than doubling to 26 million by 2015.
National parks started from the lowest base, at just 6 million visits in 1990. Growth was slow at first, but it accelerated sharply after 2000, and national parks had overtaken historic houses by 2005 and theme parks by 2010, finishing at 22 million, almost four times their original level.
Theme parks followed a different pattern. Their visits roughly doubled from 8 million to a peak of 17 million in 2005, but then declined slightly to 15 million by the end of the period.
Commentary
- TA: The overview picks out the key trends (general growth, the rise of museums, the dramatic growth of national parks and the decline of historic houses) without listing figures. The body paragraphs support it with accurate data, and every line on the graph is covered.
- CC: Each paragraph focuses on one or two lines, and the writer moves logically from the attractions that changed places at the top to the fastest riser and then to the line with a different shape. Linking words ("However", "by contrast", "but then") show contrasts clearly.
- LR: The language of trends is precise and varied ("fell gradually", "grew steadily", "accelerated sharply", "a peak of", "declined slightly", "from the lowest base").
- GRA: A range of structures is used accurately, including participle clauses ("reaching 11 million in 2015", "finishing at 22 million") and multiplier expressions ("almost four times their original level").
WRITING TASK 2
You should spend about 40 minutes on this task.
Write about the following topic:
In many cities, the cost of buying or renting a home has risen much faster than people's incomes.
What problems does this cause? What measures could be taken to solve these problems?
Give reasons for your answer and include any relevant examples from your own knowledge or experience.
Write at least 250 words.
Write at least 250 words. Suggested time: 40 minutes.
Drafts are saved in this browser. Use Download my writing to keep a separate copy.
View Task 2 sample response and commentary
Write your own response before opening this example. This is a sample from the book, not a score or assessment of your writing.
In many cities around the world, house prices and rents have increased far more quickly than wages. This has created serious difficulties for individuals and for society as a whole, but there are several measures that governments could take to reduce them.
The most obvious problem is that many people, especially the young, can no longer afford a home of their own. Instead of buying a flat in their twenties, as their parents may have done, many young adults now spend a large share of their income on rent, which makes it almost impossible to save for a deposit. Some remain in their parents' homes well into their thirties, which can delay decisions such as marriage and having children.
High housing costs also affect cities themselves. Workers on modest incomes, such as nurses, teachers and bus drivers, are often forced to move further away and commute long distances. This increases traffic and pollution, and it can make it difficult for hospitals and schools to recruit and keep staff. In the long run, a city that only the wealthy can afford to live in risks losing much of its energy and diversity.
The most effective solution would be to increase the supply of homes. Governments could simplify planning rules, encourage the conversion of empty offices and shops into flats, and build more social housing that is rented at below-market rates. In addition, cities could require developers to include a proportion of affordable homes in every new project. Measures to protect tenants, such as limits on how much rents can rise each year, could also provide short-term relief, although they need to be designed carefully so that landlords are not discouraged from renting out property.
In conclusion, rapidly rising housing costs make it harder for young people to establish independent lives and threaten the long-term health of cities. Although there is no simple solution, building more homes, especially affordable ones, combined with sensible protection for tenants, would go a long way towards easing the problem.
Commentary
- TR: Both parts of the question are answered fully. Two clear problems are developed with explanation and examples, and the solutions are linked to those problems. The writer also recognises a possible drawback of rent controls, which shows balanced thinking.
- CC: The essay has a clear structure: an introduction that outlines the answer, two paragraphs on problems, one on solutions, and a conclusion. Each paragraph has a clear topic sentence, and referencing is used well ("This increases", "they need to be designed").
- LR: Topic vocabulary is precise and natural ("a deposit", "social housing", "below-market rates", "affordable homes", "tenants", "planning rules"). Collocations such as "a large share of their income" and "go a long way towards" are used accurately.
- GRA: Complex sentences with relative clauses, conditionals and passive forms are handled accurately ("Workers on modest incomes... are often forced to move", "so that landlords are not discouraged").
Clear both responses and reset this writing paper's timer? This cannot be undone.
About the book’s sample responses
Original IELTS-style practice material. Not produced or endorsed by IELTS, the British Council, IDP or Cambridge University Press & Assessment.
About these samples: Each sample was written to show a strong response at roughly Band 7.5–8. The band estimates are based on the public IELTS band descriptors. They are a guide only, not an official score, and no certified examiner has marked these responses. Commentary is organised by the four criteria used for IELTS Writing:
- TA/TR: Task Achievement (Task 1) or Task Response (Task 2)
- CC: Coherence and Cohesion
- LR: Lexical Resource
- GRA: Grammatical Range and Accuracy
Submit your writing
Save both task responses for review. Writing is not given an automatic band score. Name and email are required; phone is optional.