PRACTICE SERIES 1 · TEST 10
IELTS Academic Writing Practice Test 10
Daily water use in three cities · Fast home delivery
Before you begin
Complete both tasks. Allow about 20 minutes for Task 1 and 40 minutes for Task 2. Write at least 150 and 250 words respectively. The timer is shared across both tasks.
Original IELTS-style practice material. Not produced or endorsed by IELTS, the British Council, IDP or Cambridge University Press & Assessment. Drafts save in this browser. Use Submit writing below to save your responses for review; no automatic band score is awarded.
WRITING TASK 1
You should spend about 20 minutes on this task.
The graph below shows the average amount of water used per person each day in three cities between 2000 and 2025.
Summarise the information by selecting and reporting the main features, and make comparisons where relevant.
Write at least 150 words.
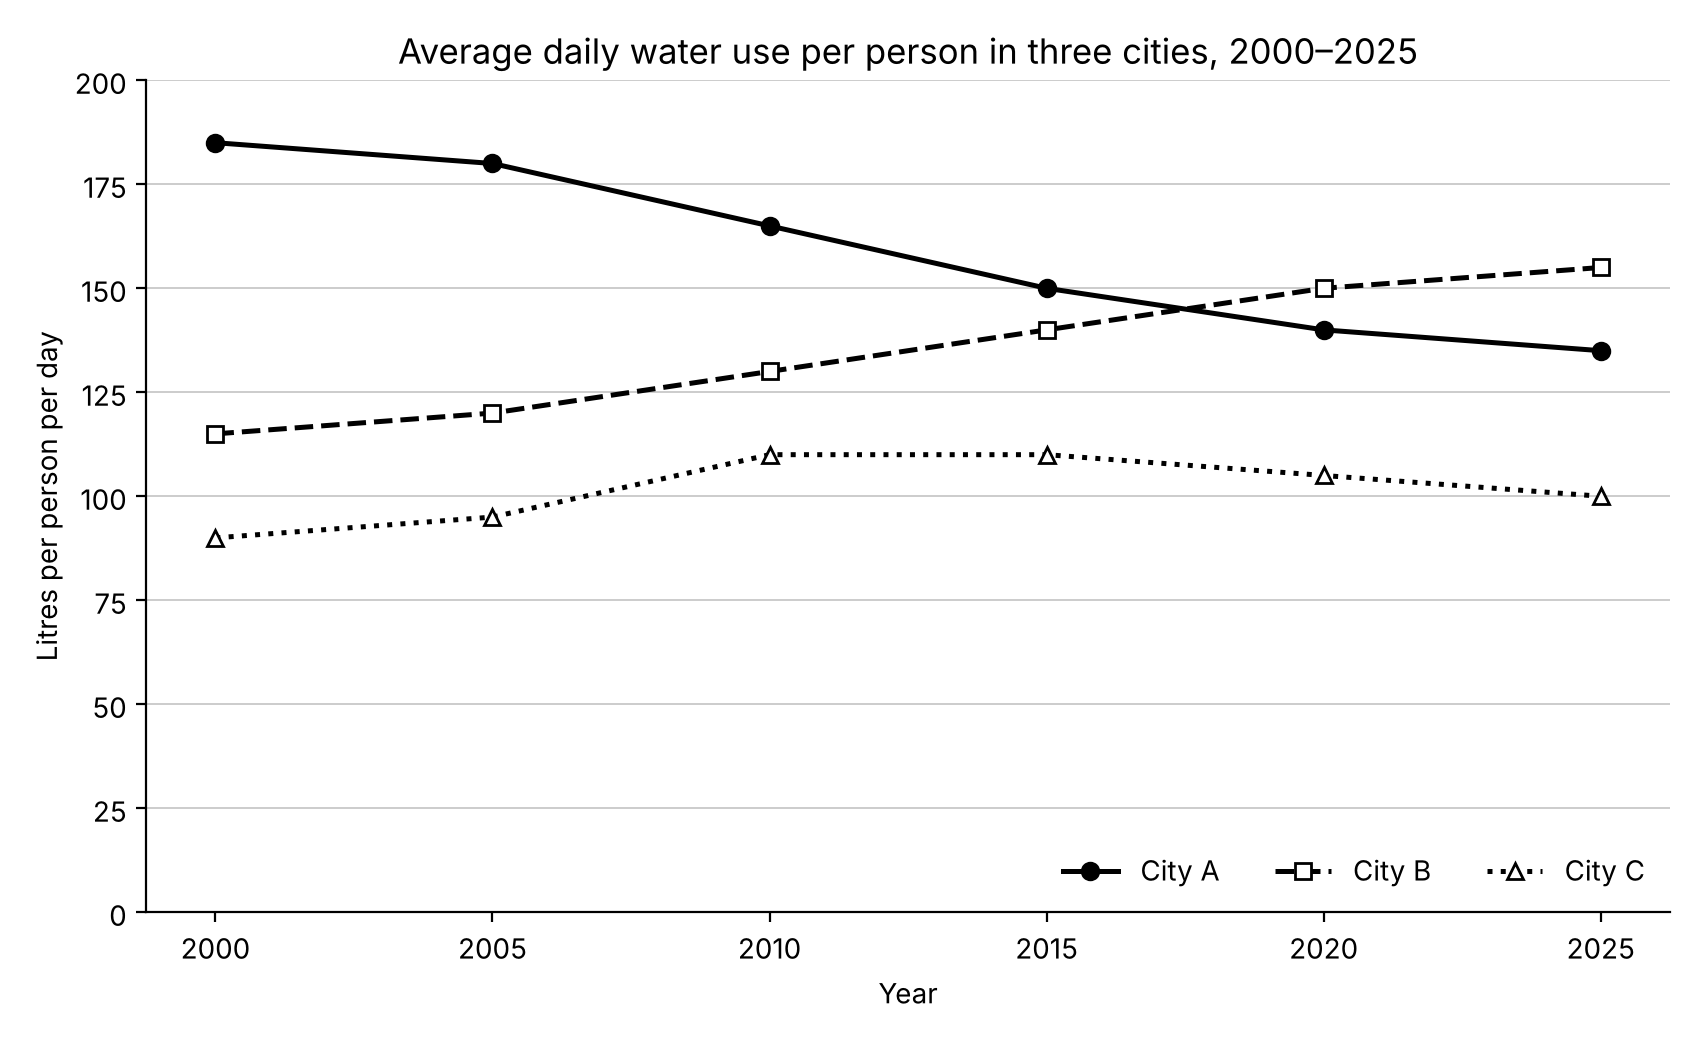
If the graph does not display, use this table. It contains the same information.
| Litres per person per day | 2000 | 2005 | 2010 | 2015 | 2020 | 2025 |
|---|---|---|---|---|---|---|
| City A | 185 | 180 | 165 | 150 | 140 | 135 |
| City B | 115 | 120 | 130 | 140 | 150 | 155 |
| City C | 90 | 95 | 110 | 110 | 105 | 100 |
Write at least 150 words. Suggested time: 20 minutes.
Drafts are saved in this browser. Use Download my writing to keep a separate copy.
View Task 1 sample response and commentary
Write your own response before opening this example. This is a sample from the book, not a score or assessment of your writing.
The line graph shows how much water was used, on average, by each person per day in three cities over the twenty-five years from 2000 to 2025.
Overall, water use in City A fell steadily, while in City B it rose throughout the period. As a result, City A, which had the highest consumption at the start, was overtaken by City B. City C consistently used the least water, and its figure changed relatively little.
In 2000, residents of City A used an average of 185 litres each per day, which was more than double the figure for City C (90 litres) and 70 litres more than in City B. Consumption in City A then declined every five years, reaching 135 litres in 2025, a drop of 50 litres in total.
City B followed the opposite trend. Its figure increased gradually from 115 to 155 litres, and it passed City A between 2015 and 2020, ending the period as the highest of the three.
In City C, water use rose from 90 to 110 litres between 2000 and 2010 and stayed at that level until 2015. It then fell slightly to 100 litres in 2025, still well below the other two cities.
Commentary
- TA: The overview identifies the three main features (the fall in A, the rise in B, and C remaining the lowest) and the change in ranking between A and B; the fourth paragraph gives the interval in which B overtook A. Each city is described accurately with selected figures, and the response compares the cities rather than listing every number. It does not suggest reasons for the changes, which are not shown in the graph.
- CC: Each body paragraph deals with one city, and the order (A, then B as "the opposite trend", then C) makes the comparison easy to follow. Linking is natural and varied ("then", "As a result", "It then fell slightly").
- LR: Accurate language of trends and comparison ("declined every five years", "followed the opposite trend", "more than double", "consistently used the least").
- GRA: A good range of structures, including a non-defining relative clause ("City A, which had the highest consumption at the start, was overtaken..."), a passive, and participle clauses ("reaching 135 litres in 2025", "ending the period as the highest").
WRITING TASK 2
You should spend about 40 minutes on this task.
Write about the following topic:
In many places, people can now order goods online and have them delivered to their door within a few hours.
Do the advantages of this development outweigh the disadvantages?
Give reasons for your answer and include any relevant examples from your own knowledge or experience.
Write at least 250 words.
Write at least 250 words. Suggested time: 40 minutes.
Drafts are saved in this browser. Use Download my writing to keep a separate copy.
View Task 2 sample response and commentary
Write your own response before opening this example. This is a sample from the book, not a score or assessment of your writing.
In many cities, it is now possible to order almost anything online, from groceries to electronics, and receive it within a few hours. While this service brings real convenience, I believe that its disadvantages, for workers, for local communities and for the environment, are greater than its benefits.
There are certainly advantages. Fast delivery saves time for busy people, and it can be extremely valuable for people who struggle to leave home, such as elderly or disabled people, or parents caring for young children. Speed itself can also matter: a carer who discovers in the morning that an essential item has run out can receive it that afternoon, before leaving for a shift. It also creates jobs, and during periods when shops have had to close, delivery services have allowed people to obtain essential items safely.
However, these benefits come at a cost. To deliver goods within hours, companies need large numbers of drivers and warehouse staff who work under intense pressure. Many are paid per delivery rather than per hour, and they often have little job security. In addition, rapid delivery encourages people to buy items one at a time, as soon as they want them, instead of combining their purchases. This means more vans on the roads, more traffic and more pollution, as well as more packaging. Receiving an item a few hours sooner is rarely worth the extra trips that separate deliveries require.
Fast delivery may also harm local high streets. When people can receive a product within hours without leaving home, they have less reason to visit nearby shops. Small businesses that cannot offer the same service may close, and town centres can lose much of their life. This affects not only shop owners but also everyone who values a lively local community.
In conclusion, although same-day delivery is undoubtedly convenient and can help people with genuine needs, I believe its disadvantages outweigh its advantages. A slower service, in which orders are grouped together and workers are treated fairly, would keep most of the benefits while reducing much of the harm.
Commentary
- TR: The question asks whether the advantages outweigh the disadvantages, and the writer gives a clear answer in the introduction and conclusion. Both sides are discussed, with the advantages fairly presented before being weighed against three disadvantages. The conclusion adds a practical suggestion that follows from the argument.
- CC: One paragraph for the advantages, then two paragraphs for different kinds of disadvantage, each with a clear topic sentence. Cohesive devices are used naturally rather than mechanically ("However, these benefits come at a cost", "This means", "This affects").
- LR: Precise and natural vocabulary ("intense pressure", "job security", "combining their purchases", "lose much of their life"), with very little repetition.
- GRA: Complex sentences are used accurately, including relative clauses ("A slower service, in which orders are grouped together..."), conditionals and passive forms. Errors are rare.
Clear both responses and reset this writing paper's timer? This cannot be undone.
About the book’s sample responses
Original IELTS-style practice material. Not produced or endorsed by IELTS, the British Council, IDP or Cambridge University Press & Assessment.
About these samples: Each sample was written to show a strong response at roughly Band 7.5–8. The band estimates are based on the public IELTS band descriptors. They are a guide only, not an official score, and no certified examiner has marked these responses. Commentary is organised by the four criteria used for IELTS Writing:
- TA/TR: Task Achievement (Task 1) or Task Response (Task 2)
- CC: Coherence and Cohesion
- LR: Lexical Resource
- GRA: Grammatical Range and Accuracy
Submit your writing
Save both task responses for review. Writing is not given an automatic band score. Name and email are required; phone is optional.