PRACTICE SERIES 1 · TEST 3
Academic Writing
Electricity sources and use · Spending on space exploration
Before you begin
Complete both tasks. Allow about 20 minutes for Task 1 and 40 minutes for Task 2. Write at least 150 and 250 words respectively. The timer is shared across both tasks.
Original IELTS-style practice material. Not produced or endorsed by IELTS, the British Council, IDP or Cambridge University Press & Assessment. Drafts save in this browser. Use Submit writing below to save your responses for review; no automatic band score is awarded.
WRITING TASK 1
You should spend about 20 minutes on this task.
The bar chart below shows the percentage of electricity generated from four sources in one country in 2000, 2010 and 2020. The pie chart shows how electricity was used in the same country in 2020.
Summarise the information by selecting and reporting the main features, and make comparisons where relevant.
Write at least 150 words.
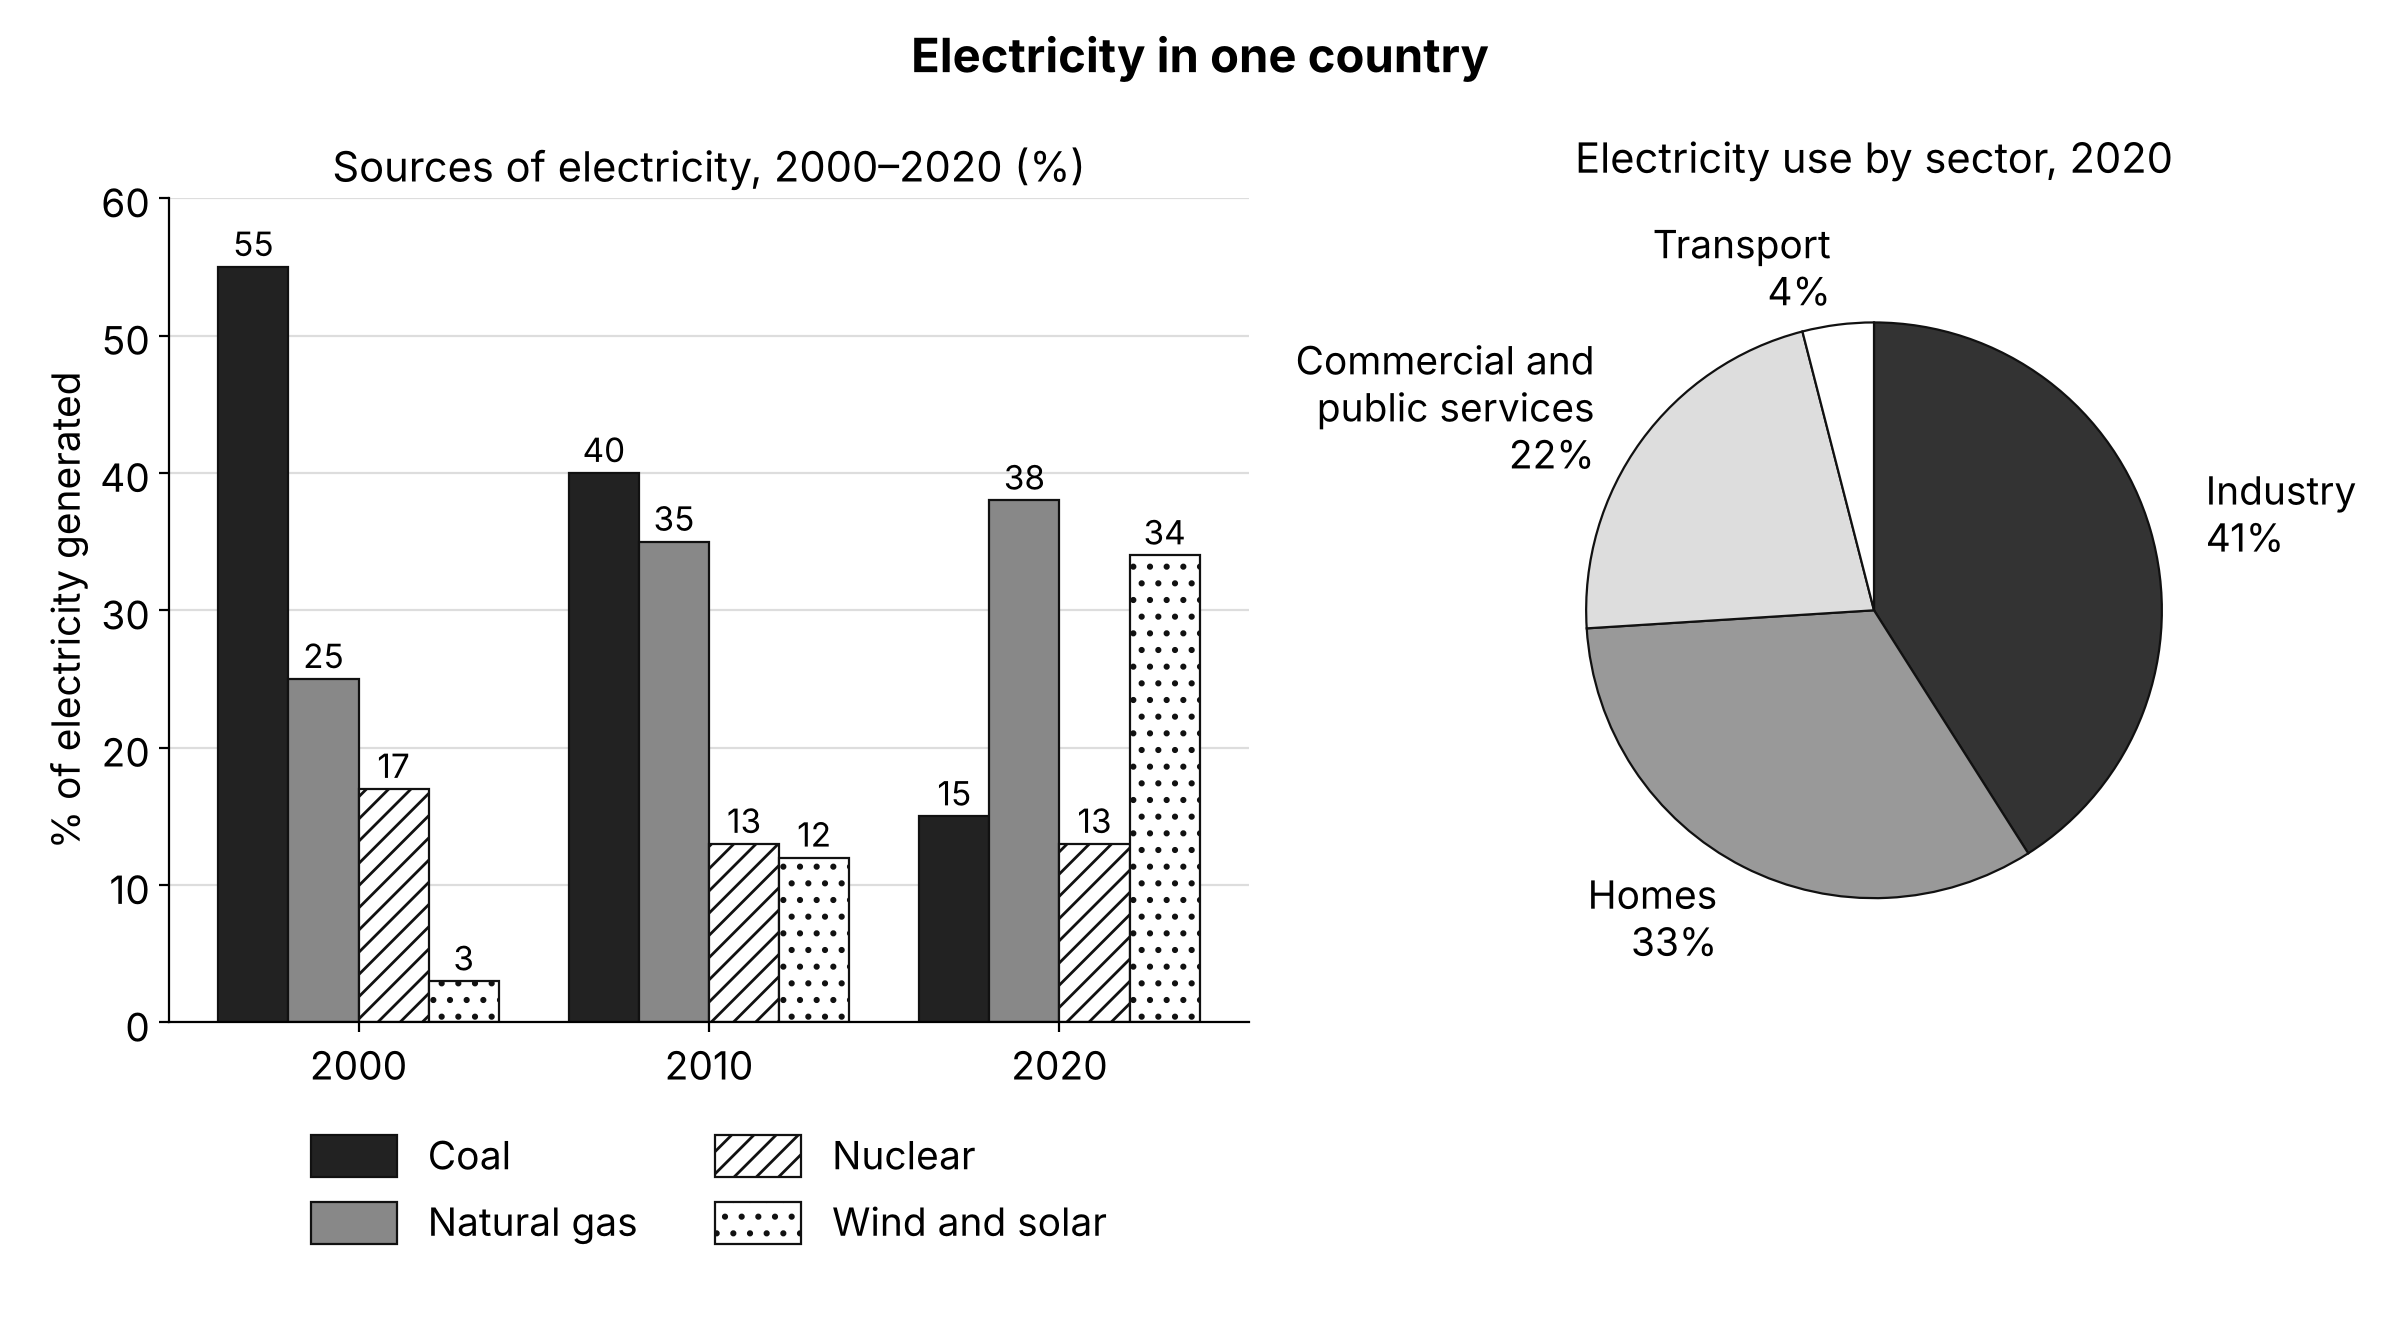
If the charts do not display, use these tables. They contain the same information.
| Sources of electricity (% of total) | 2000 | 2010 | 2020 |
|---|---|---|---|
| Coal | 55 | 40 | 15 |
| Natural gas | 25 | 35 | 38 |
| Nuclear | 17 | 13 | 13 |
| Wind and solar | 3 | 12 | 34 |
| Electricity use by sector, 2020 | % |
|---|---|
| Industry | 41 |
| Homes | 33 |
| Commercial and public services | 22 |
| Transport | 4 |
Write at least 150 words. Suggested time: 20 minutes.
Drafts are saved in this browser. Use Download my writing to keep a separate copy.
View Task 1 sample response and commentary
Write your own response before opening this example. This is a sample from the book, not a score or assessment of your writing.
The bar chart compares the proportion of a country's electricity that came from four sources in 2000, 2010 and 2020, while the pie chart shows which sectors consumed electricity in 2020.
Overall, the country moved away from coal and towards renewable energy over the twenty-year period, with natural gas also becoming more important. In 2020, industry and homes together accounted for roughly three quarters of all electricity use.
In 2000, coal was by far the largest source, generating 55% of the country's electricity, followed by natural gas at 25% and nuclear power at 17%. Wind and solar power contributed only 3%. Over the next two decades, the share of coal fell sharply, to 40% in 2010 and just 15% in 2020. By contrast, wind and solar grew more than tenfold, reaching 34% by the end of the period, only slightly below natural gas, which had risen steadily to 38% and become the leading source. Nuclear power was the most stable source, dropping from 17% to 13% in 2010 and remaining at that level.
Turning to consumption, industry was the largest user in 2020, at 41%, followed by homes at 33%. Commercial and public services used just over a fifth of the total, while transport accounted for only 4%.
Commentary
- TA: Both charts are covered, and the overview links them clearly: the shift from coal to renewables, and the dominance of industry and homes. Figures are selected rather than listed, and the change in rank (natural gas becoming "the leading source") is noticed, which is a key feature many candidates miss.
- CC: The response has one paragraph for each chart, with a clear signpost ("Turning to consumption"). "By contrast" and "which had risen steadily" link the contrasting trends smoothly.
- LR: There is precise vocabulary for proportion and change ("by far the largest", "grew more than tenfold", "just over a fifth", "accounted for"), with accurate collocations.
- GRA: Participle clauses ("generating 55%", "reaching 34%"), a past perfect relative clause ("which had risen steadily") and comparisons are all used accurately.
- Possible improvements: The overview could give more weight to the narrowing gap between natural gas and wind and solar in 2020, which is one of the most significant features. The opening sentence could also move further away from the wording of the task.
WRITING TASK 2
You should spend about 40 minutes on this task.
Write about the following topic:
Governments in many countries spend large amounts of money on exploring space. Some people believe that this money would be better spent on solving problems here on Earth.
To what extent do you agree or disagree?
Give reasons for your answer and include any relevant examples from your own knowledge or experience.
Write at least 250 words.
Write at least 250 words. Suggested time: 40 minutes.
Drafts are saved in this browser. Use Download my writing to keep a separate copy.
View Task 2 sample response and commentary
Write your own response before opening this example. This is a sample from the book, not a score or assessment of your writing.
Many governments invest billions in space programmes, and critics argue that this money should instead be used to tackle urgent problems such as poverty, disease and climate change. While I understand this view, I largely disagree with it, because space research often helps to solve the very problems its critics are concerned about.
It is easy to see why some people object to space spending. Sending a single mission to Mars can cost more than many countries spend on healthcare in a year, and it can seem wrong to fund rockets while millions of people lack clean water or basic medicine. In addition, the benefits of exploring distant planets are uncertain and may not be felt for decades, whereas the needs of people on Earth are immediate.
However, this argument assumes that space exploration and solving problems on Earth are separate activities, when in fact they are closely connected. Satellites, which were developed through space programmes, are now essential for forecasting extreme weather, monitoring deforestation and measuring the melting of polar ice. Without them, our understanding of climate change would be far weaker. Similarly, technology first designed for spacecraft has led to improvements in water purification, medical imaging and solar panels. Space research also inspires young people to study science and engineering, which benefits every area of the economy.
It is also worth noting that space budgets are much smaller than many people assume. In most countries, they represent a tiny fraction of government spending, far less than is spent on defence or healthcare. Cutting them would therefore make little difference to the scale of problems such as poverty.
In conclusion, although the costs of space exploration can seem hard to justify, I believe that governments are right to continue funding it. The knowledge and technology it produces have already helped to address many problems on Earth, and the money involved is small compared with its long-term benefits.
Commentary
- TR: The writer's position ("I largely disagree") is clear from the introduction and maintained throughout. The opposing view is presented fairly before being answered, and the main argument (that space research helps solve problems on Earth) is supported with specific examples.
- CC: Paragraphs follow a clear argument: the opposing view, the main counter-argument, an additional point and a conclusion. Cohesive devices ("However", "Similarly", "It is also worth noting", "therefore") are varied and accurate.
- LR: The vocabulary is precise and topic-specific, for example "space programmes", "monitoring deforestation", "water purification", "medical imaging", "a tiny fraction of government spending".
- GRA: A wide range of complex structures is used accurately, including concessive clauses ("While I understand this view"), non-defining relative clauses ("which were developed through space programmes") and a conditional ("Without them, … would be").
- Possible improvements: The claim about budgets would be stronger with a specific example, and the point about inspiring young people is stated rather than developed.
Clear both responses and reset this writing paper's timer? This cannot be undone.
About the book’s sample responses
Original IELTS-style practice material. Not produced or endorsed by IELTS, the British Council, IDP or Cambridge University Press & Assessment.
About these samples: Each sample was written to show a strong response at roughly Band 7.5–8. The band estimates are based on the public IELTS band descriptors. They are a guide only, not an official score, and no certified examiner has marked these responses. Commentary is organised by the four criteria used for IELTS Writing:
- TA/TR: Task Achievement (Task 1) or Task Response (Task 2)
- CC: Coherence and Cohesion
- LR: Lexical Resource
- GRA: Grammatical Range and Accuracy
Submit your writing
Save both task responses for review. Writing is not given an automatic band score. Name and email are required; phone is optional.